COVID19 Analytics & Insights
 In this post we share a couple of interesting findings from our analytics guys on the Covid19 pandemic.
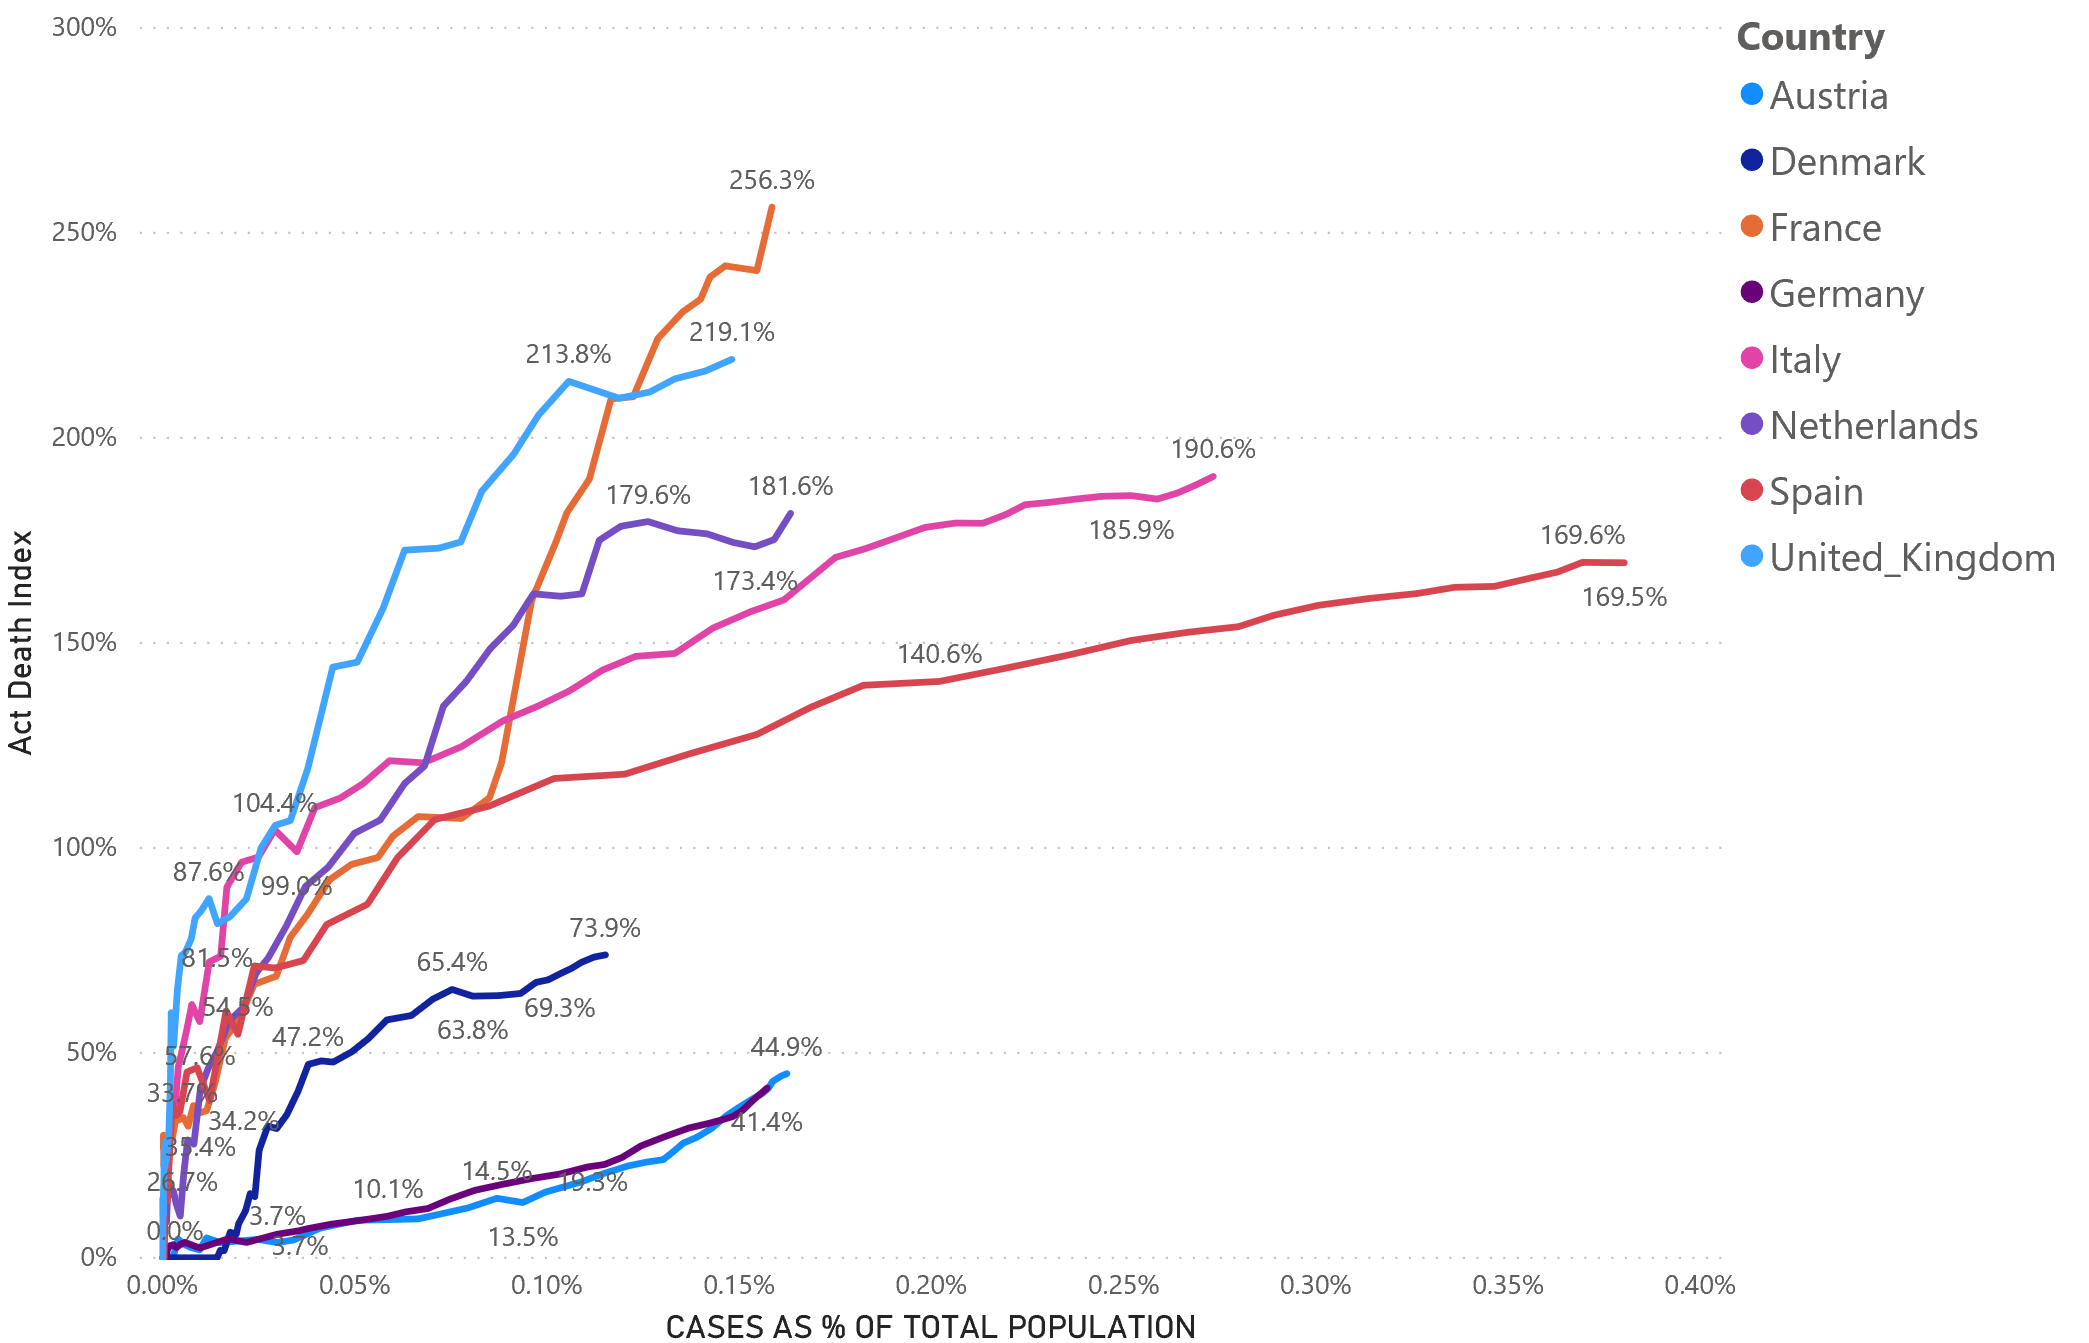
This first one on the left is a chart that represents an effort to make the number of #covid deaths comparable among different countries by taking into account the different demographics in terms of size and age distribution by considering the actual total population and share of people over 65 in each country.
On the X axis there are #covid deceased as a percentage of the total population while on the Y axis there’s an index that we’ve called Actual Death Index representing the number of actual deaths as a percentage of expected deaths. Expected deaths are calculated considering the same detectability of covid19 cases across countries and the same death or mortality rates among population equal in every country. The similarity between some of such curves is strikingly surprising. Especially that between the “top performers” Austria and Germany. The chart also shows that until now Italy is not the worst performing country in terms of deaths and that, even if growing, the trend of deaths is generally improving significantly over time probably because of an increasing capacity of coping with the pandemic despite still dramatically increasing numbers in terms of infected.
The plot below is the result of an attempt to relate the number of #covid19 deceased to some explanatory variables. Regarding this, we’ve identified a model based on 7 covariates that, considering the general variability of aggregated (national) data shows a surprisingly strong coefficient of determination of 95.7%.

Although initially, we’ve found a rather strong correlation between the number of deaths and per capita number of Critical Care Beds, this multiple linear regression model applied to 15 EU countries, those for which all the covariates are available, is made of the following 7 variables:
- the number of hospital beds every 100 inhabitants (or beds per capita, that only affects coefficient value)
- the percentage of population over 65 years old
- national per capita health care expenditure
- the number of cases as percentage of total population
- the percentage of deaths for the following diseases in 2017 (according to EUROSTAT classification)
- Diabetes Mellitus
- Pneumonia
- Other Lower Respiratory Diseases
These and other interactive analytics are available at: http://www.cpsweb.it/covid-2019-analytics/
Hope you find this interesting.
Data Sources: ECDC, EUROSTAT
Tools: Microsoft Power BI, Cran R