COVID19 – Summary – Dashboard, Trends & Model
COVID-19 worldwide data.
The following dashboard shows the numbers of Covid-19 cases and deaths by country in absolute numbers and as percentage of country’s total population.
You may interact with charts and maps to focus on specific countries and expand the dashboard by clicking the arrow icon on the right of the lower grey bar.
You can also focus on a specific chart or map by clicking the focus mode icon that appears on its top right corner.
Considering the sharp divide in terms of effect of the Covid19 between people over 65 and the younger and the fact that some countries have significant less shares of over 65 than others – in example Italy has 22.75% while Belgium has 18.79% -, in order to facilitate a comparison of Covid19 deceased across countries, we develop the following chart in which the different demographics have been taken into account.
The (reasonable) assumptions here, because of the lack of detailed national data, are:
- that the virus has the same lethality by age in each county
- that, in each country, cases emerge according to the same dynamics because the detection of cases is mainly related to the severity of illnesses which is equally distributed by age.
Given these simple assumptions, for each country, we calculated the number of expected deaths given the ages distribution of each demographics, the same lethality for each age group and the number of cases. We’ve then calculated an index we’ve called the Actual Deaths Index (on the Y axis) that is the Actual Deaths as a percentage of the Expected Deaths.
Such Actual Deaths Index has then been plotted against the total cases in the upper chart and against the value that is cases as percentage of total population (on the X axis) lower chart.
The resulting shapes of the curves for each country makes sense and show, among others, the following valuable insights.
- Most countries’ ability to cope with the disease has improved over time with similar timings.
- Countries with similar national health service and care protocols show very similar performance. In particular, the curves of Germany and Austria are strikingly similar, almost completely overlapping each other, and both countries performed exceptionally well since the very first stages.
- Countries that seem to perform better in absolute numbers may perform worse when considering the different shares of people over 65.
- Curves becomes much more similar when considering deaths as percentage of country’s population.
- Despite few sad exceptions, the slope of most of the curves tends to become quite similar over time.
However, consistent gaps remain between top performers and the others that we have tried to investigate considering further variables which in many cases are not easy to collect for countries all around the world.
Therefore, we decided to focus our attention European countries and got uniform data from the EUROSTAT database.
Those who are familiar with analyzing aggregated national or regional data probably know that when it comes to regressions it is very hard to experience strong statistics indicators and therefore, we were very surprised to verify that the following model explains the number of covid victims on a sample of 15 countries with a 97.4% determination coefficient.
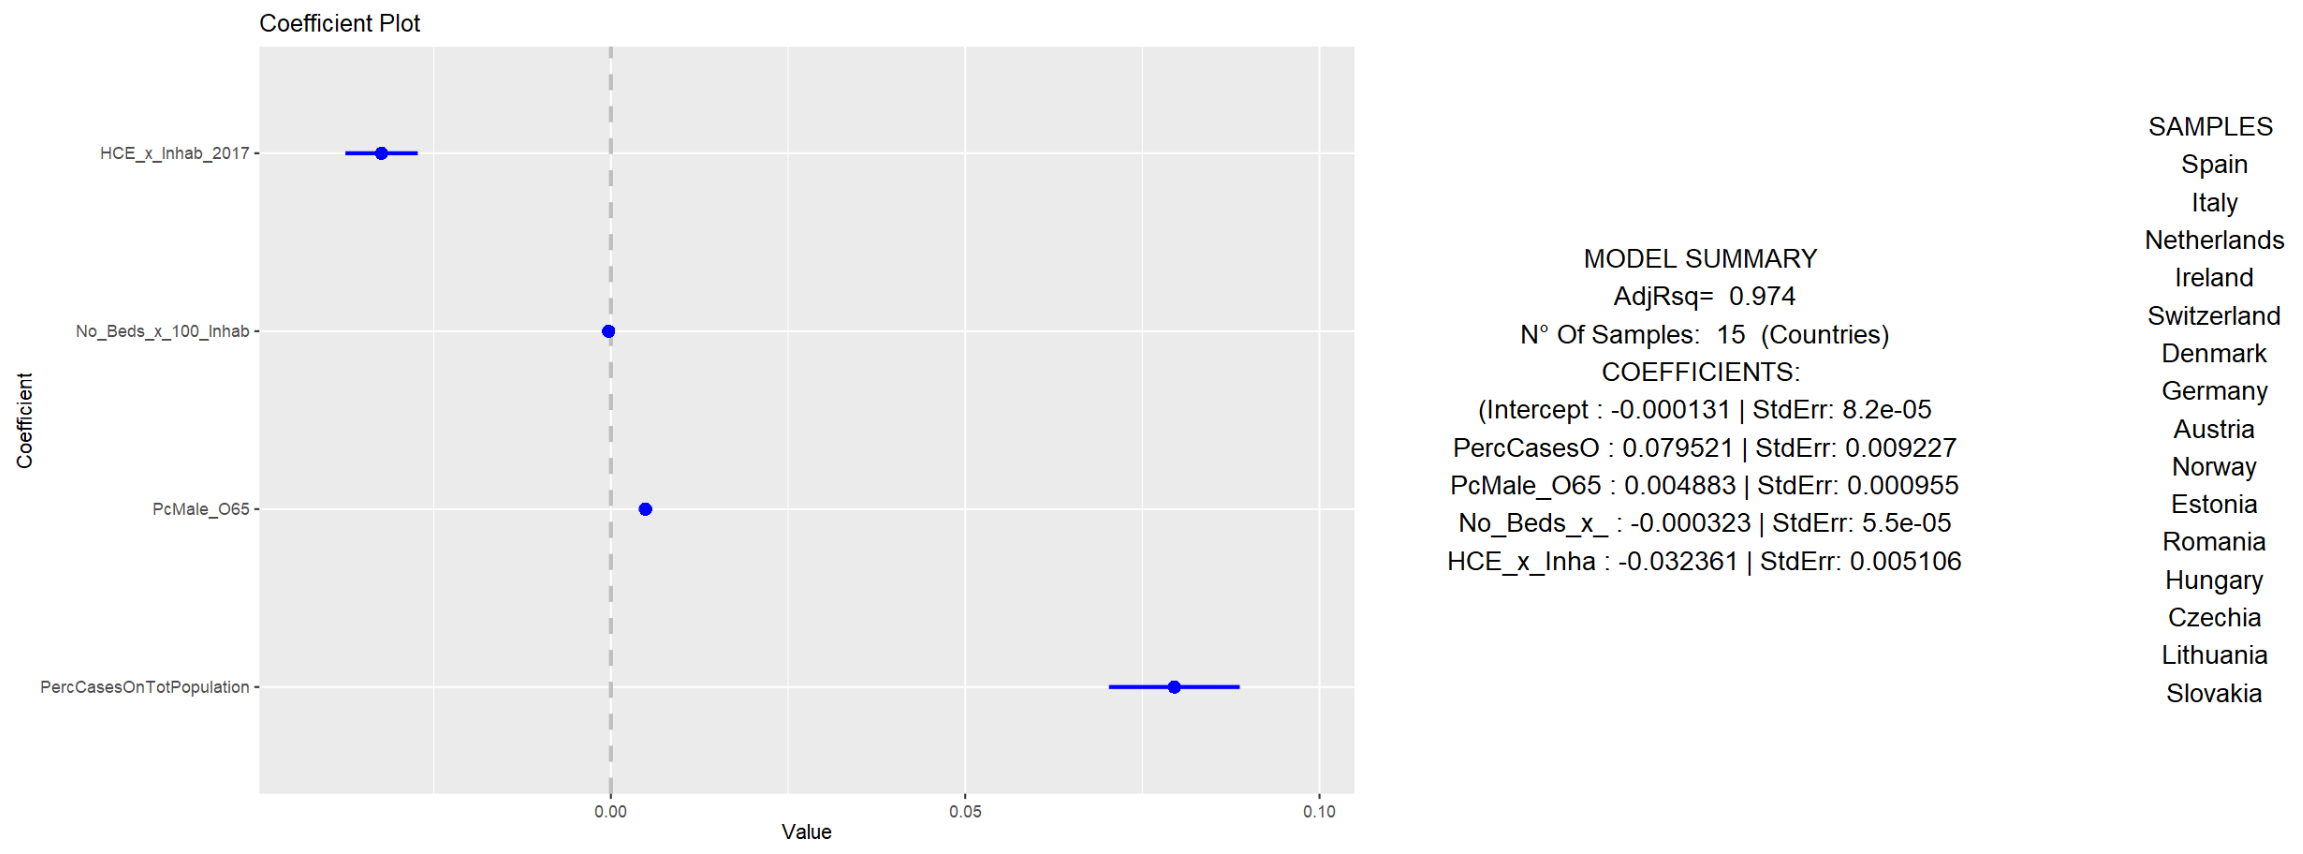
It is a multiple linear regression model that seems to explains the percentage of Covid deceased on country’s total population depending on the following 4 variables:
- Obviously the percentage of cases on the overall population
- The per capita National Health Care Expenditure
- The percentage of Male over 65 years old
- The number of hospital bed per capita (that does not show particular collinearity with Health Care Expenditure)
Hope you’ve found this article a and the underlying exercise interesting.
Feel free to submit any comment or suggestion and access further analytics in our website section dedicated to Coronavirus Analytics.